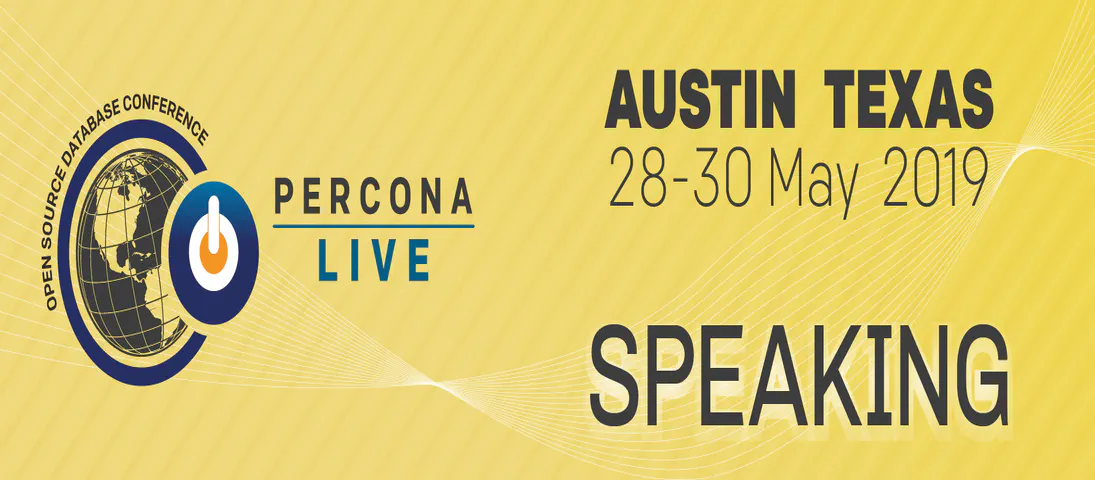
Percona Live 2019
- Steve Scargall
- Conferences , Events
- April 4, 2019
I will be speaking at this year’s Percona Live event. Percona Live 2019 takes place in Austin, Texas from May 28-30, 2019 at the Hyatt Regency . You can register for the event and check out the schedule of talks. See you there.
About Percona Live
Percona Live conferences provide the open source database community with an opportunity to discover and discuss the latest open source trends, technologies and innovations. The conference includes the best and brightest innovators and influencers in the open source database industry.
Our daily sessions, day-one tutorials, demonstrations, keynotes and events provide access to what is happening NOW in the world of open source databases. At the conference, you can mingle with all levels of the database community: DBAs, developers, C-level executives and the latest database technology trend-setters.
This conference provides an opportunity to network with peers and technology professionals by uniting the open source database community to share their knowledge, experience and use cases.
Percona Live is the place to learn about how open source database technology can power your applications, improve your websites and solve your critical database issues.
A Discussion on the Advantages Afforded MySQL DBaaS offerings hosted on Intel’s Next Gen Platform
David Cohen - Intel, Steve Scargall - Intel
In this talk, we discuss the use of the open source MySQL Community Edition and Percona Server projects and Intel’s Cascade Lake server platform as the primary building blocks for hosting a Database-as-a-Service (DBaaS) deployment. Data demonstrating the advantage of this configuration will be presented. Emphasis will be on deployment of an offering that provides developers with self-service, on-demand delivery of databases that run over shared infrastructure in a multi-tenant environment. Demand for DBaaS from a diverse span of market segments has driven the large Cloud Service Providers to invest in the buildout such offerings.
Today, these offerings are widely available from Multiple Cloud Providers. Until recently, however, organizations wanting to provide DBaaS from within their own data centers were left without good options. This demand is set to be addressed with the emergence of several open source projects. A second, intersecting trend is the imminent release of Intel’s next-generation Cascade Lake XEON platform and its support for byte-addressable, persistent memory via the Intel(R) Optane(TM) DC Persistent Memory product.
Our talk will dive into the intersection of these two trends starting with an overview of the Cloud Native DBaaS model. Next, a concrete description of a deployment model using Percona’s MySQL and MyRocks distributions will be introduced. This model will be supported by a two-fold, data-driven discussion on performance and density. First, a performance characterization for both the InnoDB and MyRocks storage engines is presented with the focus on comparing/contrasting the use of NVMe vis-a-vis Intel Optane DC Persistent Memory. For the latter, we include Intel Optane DC Persistent Memory volumes in fsdax as well as sector modes. Secondly, data on database instance density using a single Intel Cascade Lake server outfitted with NVMe vis-a-vis Intel Optane DC Persistent Memory will be presented. The talk will conclude with a discussion on the results and how they have influenced our plans for further work in MySQL CE/Percona Server open source projects going forward.