How To Monitor Persistent Memory Performance on Linux using PCM, Prometheus, and Grafana
- Steve Scargall
- How to , Linux , Performance
- September 16, 2021
In a previous article, I showed How To Install Prometheus and Grafana on Fedora Server . This article demonstrates how to use the open-source Process Counter Monitor (PCM) utility to collect DRAM and Intel® Optane™ Persistent Memory statistics, and visualize the data in Grafana.
Processor Counter Monitor is an application programming interface (API) and a set of tools based on the API to monitor performance and energy metrics of Intel® Core™, Xeon®, Atom™ and Xeon Phi™ processors. It can also show memory bandwidth for DRAM and Intel Optane Persistent Memory devices. PCM works on Linux, Windows, Mac OS X, FreeBSD and DragonFlyBSD operating systems.
PCM provides a number of command-line utilities for real-time monitoring. This article will focus on the pcm-sensor-server which is a pcm collector exposing metrics over http in JSON or Prometheus (exporter text based) format.
Install PCM
PCM can be built from source or installed using the RPM or DEB files available for RHEL, CentOS, Ubuntu, Debian, SLE, and openSUSE.
Build PCM from Source
Building the PCM utility from source is very simple. First, we need to create a directory to work in:
$ mkdir ~/downloads
$ cd ~/downloads/
Clone the git repository
$ git clone https://github.com/opcm/pcm
$ cd pcm
Build pcm
$ make
By default, pcm will install to /usr. You can override this, say to /usr/local, or /opt, by setting the DESTDIR environment variable
// Install to /usr (default)
$ sudo make install

// Install to another directory
$ export DESTDIR=/usr/local
$ sudo --preserve-env=DESTDIR make install
Confirm PCM is working by running pcm-memory. The following will collect three samples every second and exit.
$ sudo pcm-memory -i=3 1
Example:
$ sudo pcm-memory -i=3 1
[...snip...]
|---------------------------------------||---------------------------------------|
|-- Socket  0             --||-- Socket  1             --|
|---------------------------------------||---------------------------------------|
|-- Memory Channel Monitoring     --||-- Memory Channel Monitoring     --|
|---------------------------------------||---------------------------------------|
|-- Mem Ch  0: Reads (MB/s):     0.42 --||-- Mem Ch  0: Reads (MB/s):     0.43 --|
|-- Writes(MB/s):     0.50 --||-- Writes(MB/s):     0.52 --|
|-- PMM Reads(MB/s)   :     0.00 --||-- PMM Reads(MB/s)   :     0.00 --|
|-- PMM Writes(MB/s)  :     0.00 --||-- PMM Writes(MB/s)  :     0.00 --|
|-- Mem Ch  1: Reads (MB/s):     0.41 --||-- Mem Ch  1: Reads (MB/s):     0.42 --|
|-- Writes(MB/s):     0.49 --||-- Writes(MB/s):     0.50 --|
|-- PMM Reads(MB/s)   :     0.00 --||-- PMM Reads(MB/s)   :     0.00 --|
|-- PMM Writes(MB/s)  :     0.00 --||-- PMM Writes(MB/s)  :     0.00 --|
|-- Mem Ch  2: Reads (MB/s):     0.42 --||-- Mem Ch  2: Reads (MB/s):     0.44 --|
|-- Writes(MB/s):     0.49 --||-- Writes(MB/s):     0.53 --|
|-- PMM Reads(MB/s)   :     0.00 --||-- PMM Reads(MB/s)   :     0.00 --|
|-- PMM Writes(MB/s)  :     0.00 --||-- PMM Writes(MB/s)  :     0.00 --|
|-- Mem Ch  3: Reads (MB/s):     0.38 --||-- Mem Ch  3: Reads (MB/s):     0.43 --|
|-- Writes(MB/s):     0.40 --||-- Writes(MB/s):     0.51 --|
|-- PMM Reads(MB/s)   :     0.00 --||-- PMM Reads(MB/s)   :     0.00 --|
|-- PMM Writes(MB/s)  :     0.00 --||-- PMM Writes(MB/s)  :     0.00 --|
|-- Mem Ch  4: Reads (MB/s):     0.38 --||-- Mem Ch  4: Reads (MB/s):     0.43 --|
|-- Writes(MB/s):     0.39 --||-- Writes(MB/s):     0.51 --|
|-- PMM Reads(MB/s)   :     0.00 --||-- PMM Reads(MB/s)   :     0.00 --|
|-- PMM Writes(MB/s)  :     0.00 --||-- PMM Writes(MB/s)  :     0.00 --|
|-- Mem Ch  5: Reads (MB/s):     0.37 --||-- Mem Ch  5: Reads (MB/s):     0.43 --|
|-- Writes(MB/s):     0.39 --||-- Writes(MB/s):     0.50 --|
|-- PMM Reads(MB/s)   :     0.00 --||-- PMM Reads(MB/s)   :     0.00 --|
|-- PMM Writes(MB/s)  :     0.00 --||-- PMM Writes(MB/s)  :     0.00 --|
|-- NODE 0 Mem Read (MB/s) :     2.40 --||-- NODE 1 Mem Read (MB/s) :     2.59 --|
|-- NODE 0 Mem Write(MB/s) :     2.66 --||-- NODE 1 Mem Write(MB/s) :     3.08 --|
|-- NODE 0 PMM Read (MB/s):      0.00 --||-- NODE 1 PMM Read (MB/s):      0.00 --|
|-- NODE 0 PMM Write(MB/s):      0.00 --||-- NODE 1 PMM Write(MB/s):      0.00 --|
|-- NODE 0.0 NM read hit rate :  0.48 --||-- NODE 1.0 NM read hit rate :  0.53 --|
|-- NODE 0.1 NM read hit rate :  0.45 --||-- NODE 1.1 NM read hit rate :  0.53 --|
|-- NODE 0 Memory (MB/s):        5.05 --||-- NODE 1 Memory (MB/s):        5.67 --|
|---------------------------------------||---------------------------------------|
|---------------------------------------||---------------------------------------|
|-- System DRAM Read Throughput(MB/s):          4.99                --|
|-- System DRAM Write Throughput(MB/s):          5.73                --|
|-- System PMM Read Throughput(MB/s):          0.00                --|
|-- System PMM Write Throughput(MB/s):          0.00                --|
|-- System Read Throughput(MB/s):          4.99                --|
|-- System Write Throughput(MB/s):          5.73                --|
|-- System Memory Throughput(MB/s):         10.72                --|
|---------------------------------------||---------------------------------------|
Add a port rule to the firewall for the PCM web server. The default port is 9738, though it can be changed using the -p <port> option described in the help:
$ pcm-sensor-server --help
Usage: pcm-sensor-server [OPTION]

Valid Options:
    -d                   : Run in the background
    -p portnumber        : Run on port <portnumber> (default port is 9738)
    -r|--reset           : Reset programming of the performance counters.
    -D|--debug level     : level = 0: no debug info, > 0 increase verbosity.
    -R|--real-time       : If possible the daemon will run with real time
                           priority, could be useful under heavy load to
                           stabilize the async counter fetching.
    -h|--help            : This information
$ sudo firewall-cmd --permanent --add-port=9738/tcp
$ sudo firewall-cmd --reload
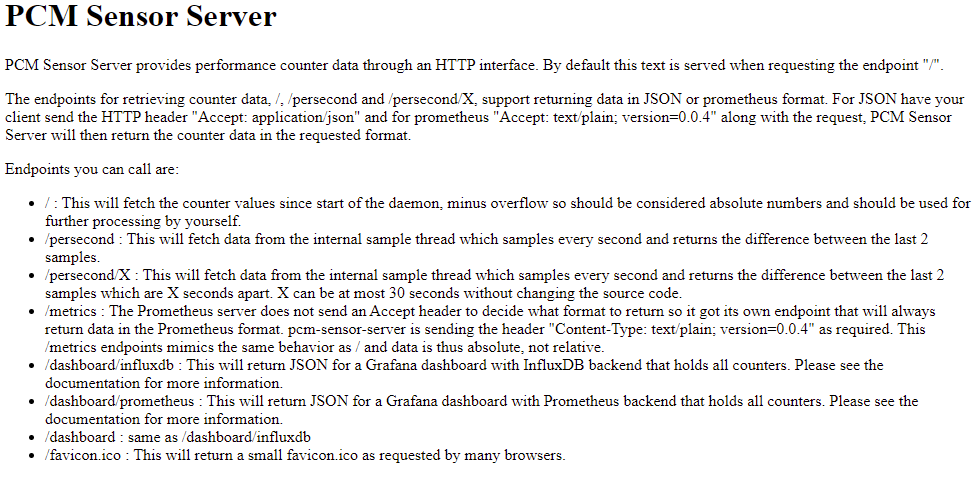
Start the pcm-sensor-server and confirm it works by navigating to http://<ip-address|hostname>:9738 in your browser
$ sudo pcm-sensor-server
[...snip...]
Starting plain HTTP server on http://localhost:9738/
You should see a simple web page that looks similar to the following:
Create a PCM-Sensor-Server Systemd Service
To run pcm-sensor-server as a systemd service, you need to create a service file, /etc/systemd/system/pcm-sensor-server.service, with the following content. Make any necessary changes for your environment.
$ sudo vi /etc/systemd/system/pcm-sensor-server.service
[Unit]
Description=Process Counter Monitor (PCM) Sensor Service
Wants=network-online.target
After=network-online.target

[Service]
User=root
Group=root
Type=simple
ExecStart=/usr/sbin/pcm-sensor-server

[Install]
WantedBy=multi-user.target
Reload systemd daemon configuration.
$ sudo systemctl daemon-reload
Start and Enable the pcm-sensor-service service to run at boot time.
$ sudo systemctl start pcm-sensor-server
$ sudo systemctl enable pcm-sensor-server
Confirm the service is running
$ systemctl status pcm-sensor-server
● pcm-sensor-server.service - Process Counter Monitor (PCM) Sensor Service
     Loaded: loaded (/etc/systemd/system/pcm-sensor-server.service; disabled; vendor preset: disabled)
     Active: active (running) since Sat 2021-03-13 14:08:35 PST; 4s ago
   Main PID: 82447 (pcm-sensor-serv)
      Tasks: 549 (limit: 629145)
     Memory: 24.3M
        CPU: 952ms
     CGroup: /system.slice/pcm-sensor-server.service
             └─82447 /usr/sbin/pcm-sensor-server

[...]
Mar 13 14:08:35 a4bf0157a780.jf.intel.com pcm-sensor-server[82447]: Starting plain HTTP server on http://localhost:9738/
Add the PCM Node to Prometheus
We need to add the target host running the pcm-sensor-server to the list of known hosts for Prometheus to scrape.
Edit /etc/prometheus.yml and add the following content to the scrape_config section of the file, or add the new target to an existing job_name group. This example includes our node_exporter on port 9100 (see the previous article
), and pcm-sensor-server on port 9738.
scrape_configs:
  [...]
  - job_name: pmem_nodes
    static_configs:
    - targets: ['10.100.118.43:9738','10.100.118.43:9100']
Restart Prometheus to pick up the new changes
$ sudo systemctl restart prometheus
$ sudo systemctl status prometheus
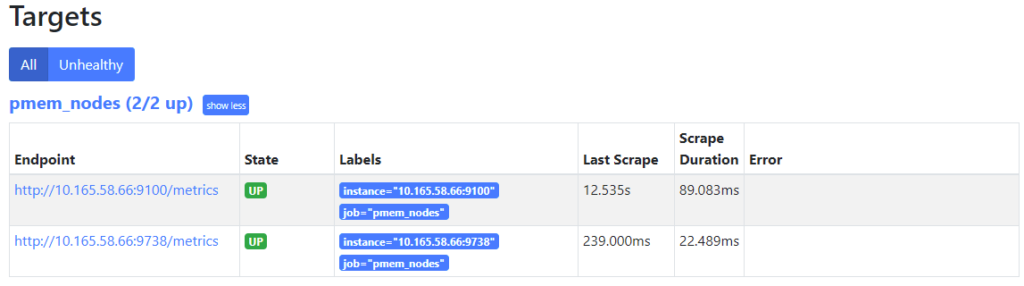
Navigate to http://<prometheus-ip>:9090/targets in your browser, and you should now see both targets under the ‘pmem_nodes’ header.
Import the Grafana Dashboard for PCM
PCM does not upstream the dashboard to https://grafana.com/grafana/dashboards
, so we must download the dashboard from the running pcm-sensor-server by navigating to http://prometheus.json file to your desktop.
Edit prometheus.json and replace all instances of "datasource": null, with "datasource": "-- Grafana --",.
Login to Grafana by navigating to [http://<server-ip](http://%3Cserver-ip/)|hostname>:3000 in your web browser. From the menu on the left, select ‘+’ -> Import.
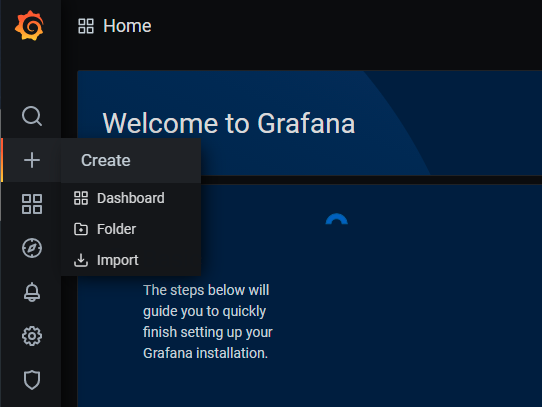
Import a Grafana Dashboard
Click ‘Upload’ and select the prometheus.json file.
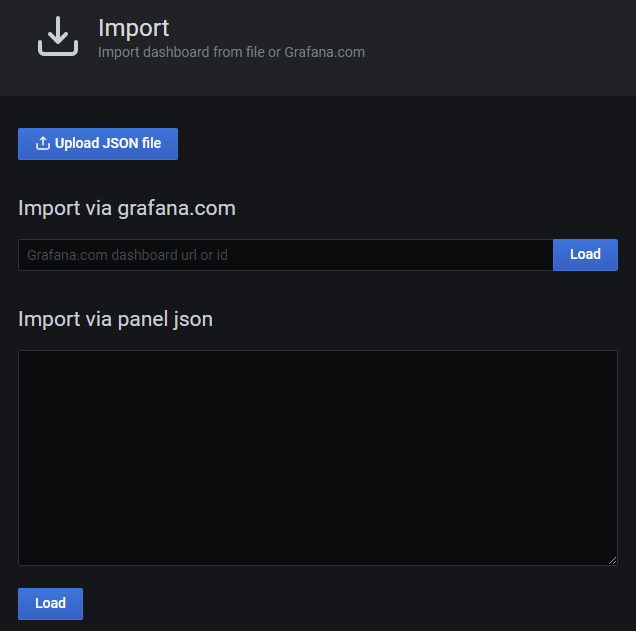
Upload a JSON file to Import it
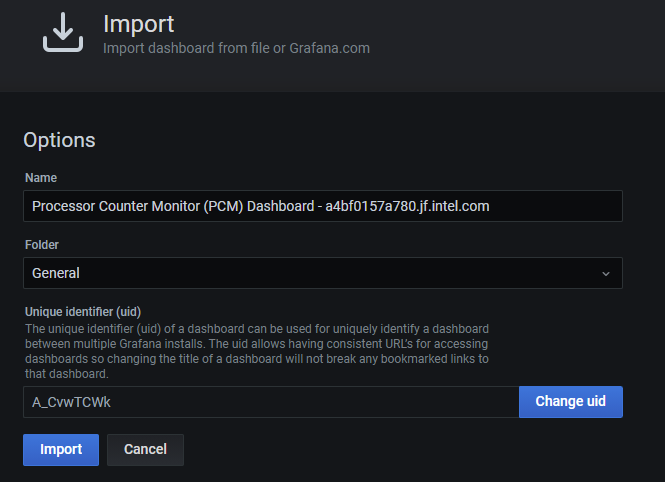
Once the JSON file is processed, you’ll be sent to the next screen to confirm the information. Click Import to continue.
TODO: Complete the procedure. The grafana dashboard is intended for a single host, so I want to modify it to support multiple hosts, like the node_exporter dashboard which has a drop-down.