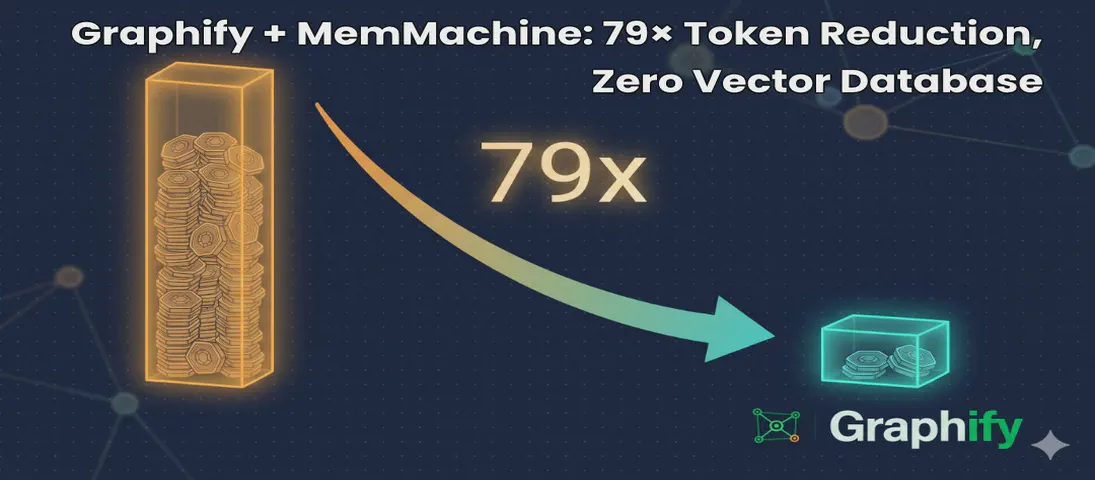
Graphify + MemMachine: 79× Token Reduction, Zero Vector Database
- Steve Scargall
- Ai
- May 10, 2026
I help maintain MemMachine — an open-source long-term memory layer for AI agents. It’s a real codebase: 442 source files, 171 docs, a graph database, a SQL store, an MCP server, a REST API, a Python SDK, and integrations with eight different agent frameworks. When a new contributor asks “where does episodic memory actually get written?”, grep, the tool of choice for many AI coding assistants, doesn’t cut it. The answer threads through five files in three folders, plus a docker-compose service definition and a Helm chart. Each question you ask, it has to search all of these files, using the LLM to semantically understand the question and the files, then piece together an answer. This can take a lot of tokens and consume much of the context window.
That’s the problem Graphify solves. One command turns the entire repository into a queryable knowledge graph — code, docs, PDFs, diagrams — and wires it into Claude Code so the assistant navigates by structure instead of grep. After a weekend of using it on MemMachine, I’m not going back. We’re seeing 79x token reductions, and zero vector database needed. The graph updates on each commit, so it’s always up to date.
This post walks through what I actually did, what came out, the two or three things that tripped me up, and an FAQ for the next person.
How Graphify works
Graphify runs three passes:
- Local AST extraction (free). Tree-sitter parses every code file — Python, TypeScript, Go, Rust, Java, SQL, and 20+ other languages — pulling out classes, functions, imports, call graphs, and inline rationale comments like
# WHY:and# HACK:. Nothing leaves your machine on this pass. - Local transcription (free). Video and audio go through faster-whisper. Transcripts are cached, seeded with your project’s “god nodes” so the prompt is domain-aware.
- Semantic extraction (LLM-backed). Docs, PDFs, and images go through your AI assistant’s underlying model — Claude in Claude Code, GPT in Codex, Gemini in Gemini CLI, or a local model via Ollama. Concepts, relationships, and design rationale are pulled out and merged into the graph.
The merged graph is clustered with the Leiden algorithm (no embeddings, no vector database — semantic similarity is just edges in the graph) and exported as three files: an interactive graph.html, a one-page GRAPH_REPORT.md, and a graph.json you can query from the CLI or as an MCP server.
Two design choices make this more useful than the GraphRAG tools I’ve tried before:
- Every edge is tagged
EXTRACTED(found directly in source),INFERRED(with a numeric confidence score), orAMBIGUOUS(flagged for review). You always know what was found versus guessed. - Rationale comments and docstrings become first-class nodes linked to the code they explain. On a project the size of MemMachine, where design intent often lives in
docs/and slowly drifts from the code, this is where the surprises live.
Install — the Claude Code path
I’m going to walk through this assuming Claude Code, because that’s how I drive it day-to-day and because using the Graphify skill within Claude Code avoids the API-key dance entirely. The semantic extraction pass is dispatched as Claude subagents, billed against your Claude Code subscription — not a separate ANTHROPIC_API_KEY. If you’re on Codex, Cursor, Gemini CLI, OpenClaw, Aider, or any of the other supported platforms, swap the platform name in the install commands; the workflow is identical.
First, install the package:
uv tool install graphifyy
The PyPI package is graphifyy (double-y — there’s a squatter on the single-y name). The CLI is still graphify.
If you have Microsoft Office files or want the MCP server later, add those extras now, otherwise, skip this step.
uv tool install 'graphifyy[office,mcp]'
[video] is there too if your repo has talks or recorded demos. MemMachine doesn’t, so I skipped it.
Install the skill — project scope (recommended)
Claude Code resolves skills from two locations: user scope (~/.claude/skills/) and project scope (.claude/skills/ inside the repo). graphify install only writes to user scope, which makes the skill active across every project on your machine — exactly the cross-project bleed you probably don’t want. The graph is created and maintained within the project directoryThe cleaner setup, that I personally prefer, is project-scoped: the skill lives in the repo, gets committed to git, and is completely invisible to any other project.
There’s no built-in --project flag yet — I filed issue #817
requesting it. The workaround until it lands is a direct file copy, which is two commands:
mkdir -p .claude/skills/graphify
curl -fsSL https://raw.githubusercontent.com/safishamsi/graphify/v6/graphify/skill.md \
  > .claude/skills/graphify/SKILL.md
Or copy from the installed package if you’d rather not hit the network:
mkdir -p .claude/skills/graphify
cp "$(python3 -c 'import graphify, os; print(os.path.join(os.path.dirname(graphify.__file__), "skill.md"))')" \
   .claude/skills/graphify/SKILL.md
Restart Claude Code, then verify:
ls .claude/skills/graphify/
# SKILL.md
Commit it so every contributor gets the skill on git pull:
git add .claude/skills/graphify/SKILL.md
git commit -m "chore: add Graphify skill (project scope)"
The project-scope skill overrides any user-scope install of the same name for this repo, so there’s no conflict if a team member happens to have run graphify install globally.
Note on
/graphifyinvocation: The/graphifyprefix is a Claude-invoked slash command meaning you can run/graphify .to begin the indexing or run a sub command, or you can ask Claude to use the skill by prompting it with something like “run graphify on this repo” or “build the knowledge graph” and Claude dispatches/graphifyitself. You can rungraphify <command>in the terminal to run the command directly without Claude.
Build the graph
From inside the repository, ask Claude Code to run graphify:
run graphify on this repo
Claude dispatches /graphify . internally and you’ll see the extraction output stream by.
One practical note: run Claude Code with --auto to suppress the per-tool approval prompts during extraction. Graphify dispatches a lot of subagent calls; without --auto you’ll be clicking through approvals for a while.
On MemMachine, the final output was:
Graph complete. Outputs in /home/<user>/MemMachine/graphify-out/

    graph.html      - interactive graph (930 communities, 1048 cross-community edges)
    GRAPH_REPORT.md - audit report (7,441 nodes / 12,355 edges)
    graph.json      - raw graph data

  Run cost: 1,397,912 input + 246,684 output tokens via Claude subagents
7,441 nodes, 12,355 edges, 930 communities across the full MemMachine codebase.
The output was written to /home/<user>/MemMachine/graphify-out/:
$ ls /home/<user>/MemMachine/graphify-out/
GRAPH_REPORT.md
cache/
cost.json
graph.html
graph.json
manifest.json
Open graph.html in a browser. Skim GRAPH_REPORT.md. Keep graph.json for query commands and the MCP server.
What the graph actually found
The GRAPH_REPORT.md is the file worth reading before anything else. Here’s what it surfaced for MemMachine.
God nodes — the most-connected concepts everything else flows through:
| Rank | Node | Edges |
|---|---|---|
| 1 | TestMemory | 127 |
| 2 | SpecDoc | 99 |
| 3 | parse_filter() | 85 |
| 4 | Memory | 85 |
| 5 | MemMachine | 79 |
| 6 | Comparison | 76 |
| 7 | Neo4jSemanticStorage | 76 |
| 8 | TestMemMachineIntegration | 76 |
| 9 | Examples | 75 |
| 10 | ConfigService | 75 |
The test infrastructure showing up this prominently — TestMemory at #1, TestMemMachineIntegration at #8 — is itself diagnostic. It means the tests are more deeply coupled into the graph than the production code, which in a project of this age usually signals that test helpers have become load-bearing fixtures.
The most interesting suggested question: Why is FilterExpr the central nervous system of the codebase, connecting the API layer to the retrieval agent, every storage backend (Neo4j, SQLAlchemy, episode store, semantic config), and the memory engines? It has a betweenness centrality of 0.042 — one of the highest bridges in the graph. SearchResult is close behind at 0.047.
Token reduction in practice
Running the benchmark (graphify benchmark) against the finished graph makes the economic argument concrete:
graphify token reduction benchmark
──────────────────────────────────────────────────
  Corpus:          372,050 words → ~496,066 tokens (naive)
  Graph:           7,441 nodes, 12,355 edges
  Avg query cost:  ~6,234 tokens
  Reduction:       79.6x fewer tokens per query

  Per question:
    [ 49.2x] how does authentication work
    [713.8x] what is the main entry point
    [ 62.5x] how are errors handled
    [ 48.3x] what connects the data layer to the api
    [227.9x] what are the core abstractions
The average 79.6× masks a meaningful spread. Questions with structurally local answers — “what is the main entry point” (713×) and “what are the core abstractions” (228×) — land on one or two god nodes and stop. The graph returns a tight subgraph almost immediately. Questions that require wider traversal — “how does authentication work” (49×) or “what connects the data layer to the API” (48×) — need to span more communities and consume proportionally more tokens, though even the worst case is still 48× cheaper than loading the raw corpus.
The practical implication: the one-time extraction cost (1.4M input + 246K output tokens on this run) pays back after roughly 240 average queries, or far fewer if your questions tend to be structurally local. On an active project where every code review, onboarding session, and debugging conversation starts with “where does X actually live?”, that’s a fast payback.
Make Claude Code always read the graph
The skill gives you /graphify commands on demand. The always-on hook is a separate step:
graphify claude install
graphify section written to /home/<user>/MemMachine/CLAUDE.md
  /home/<user>/MemMachine/.claude/settings.json  ->  PreToolUse hook registered
That writes a graphify section into the project’s CLAUDE.md and registers a PreToolUse hook that fires before every Glob and Grep call. Before Claude searches your files, it sees a reminder to read GRAPH_REPORT.md first. In practice: I stopped seeing the “let me search the codebase” preamble for repo questions. The agent has the structural map before it starts.
Keep the graph fresh
Install the git hooks to automate updating the graph after every commit or checkout. This is a one-time setup.
graphify hook install
post-commit: installed at /home/<user>/MemMachine/.git/hooks/post-commit
post-checkout: installed at /home/<user>/MemMachine/.git/hooks/post-checkout
After every git commit, the graph rebuilds incrementally. Code-only changes go through the local AST pass — no LLM cost. Doc changes need a /graphify --update to re-run semantic extraction, but the SHA256 cache means only changed files get reprocessed.
For a cron-friendly “do I need a full re-extract?” check:
graphify check-update .
Query the graph from the terminal
You don’t need to go through Claude Code to use the graph:
graphify query "why does FilterExpr connect so many storage backends?"
graphify path "Memory" "Neo4jSemanticStorage"
graphify explain "ConfigService"
graphify query runs a BFS traversal with a 2000-token budget by default. graphify path is the one I reach for most when tracing flows — give it two nodes, get back the shortest path through the graph. graphify explain is the plain-English summary of a node and its neighbors.
Expose the graph as an MCP server
This is the part that makes Graphify and MemMachine genuinely composable. Graphify can serve graph.json as an MCP server, and MemMachine already exposes its own MCP server. Wire both into Claude Desktop:
{
  "mcpServers": {
    "memmachine": {
      "command": "memmachine-mcp-stdio",
      "env": {
        "MEMMACHINE_BASE_URL": "http://localhost:8080"
      }
    },
    "graphify-memmachine-repo": {
      "type": "stdio",
      "command": "/home/<user>/MemMachine/.venv/bin/python3",
      "args": [
        "-m",
        "graphify.serve",
        "/home/<user>/MemMachine/graphify-out/graph.json"
      ]
    }
  }
}
(Use the venv path on Ubuntu to avoid PEP 668 conflicts — pip install graphifyy[mcp] into a project venv first.)
Now an agent talking to both servers has the user’s long-term memory on one side and the structural map of the MemMachine codebase on the other. If I ask “based on what you know about how I use MemMachine, where in the codebase would I add a new memory type?”, the agent can pull preferences and history from MemMachine and the right files to touch from Graphify, in the same turn.
That composition is the headline result for me. MemMachine is the memory of what you and your agents have done. Graphify is the memory of what your codebase actually is. Both are MCP servers. Both run locally. They compose without either tool knowing about the other.
What I’d recommend for a non-trivial repo
The minimum path from cold to “Claude reads the graph before answering”:
# Once per machine
uv tool install 'graphifyy[office,mcp]'

# Once per repo, inside the project root
mkdir -p .claude/skills/graphify
curl -fsSL https://raw.githubusercontent.com/safishamsi/graphify/v6/graphify/skill.md   > .claude/skills/graphify/SKILL.md
git add .claude/skills/graphify/SKILL.md && git commit -m "chore: add Graphify skill"
graphify claude install
graphify hook install
Then ask Claude Code: “run graphify on this repo” and Claude dispatches the extraction.
That’s it. Five commands, one ask.
Troubleshooting
error: unknown command '.' when I run graphify . from a shell.
The slash form (/graphify .) is for inside Claude Code, Codex, Cursor, etc. — your AI assistant interprets the slash and dispatches the skill. From a plain shell, use the explicit subcommand: graphify extract .. There’s also no graphify --version — use graphify --help.
graphify extract --backend claude complains about a missing ANTHROPIC_API_KEY.
The --backend claude path uses the Anthropic SDK directly and requires a paid API key — it doesn’t read your Claude Code OAuth credentials. Don’t go this route. Run /graphify . from inside Claude Code instead, and the extraction is dispatched as Claude subagents under your subscription. Same for Codex, Cursor, etc.
/graphify doesn’t appear when I type it in Claude Code.
/graphify is a Claude-invoked slash command — Claude Code calls it internally when you ask it to, e.g. “run graphify on this repo.” Typing /graphify yourself in the terminal returns This slash command can only be invoked by Claude, not directly by users. That’s expected.
If Claude Code says it doesn’t know what graphify is, the skill file isn’t where Claude Code is looking. For project-scope installs, verify:
ls .claude/skills/graphify/
# should show SKILL.md
If the file is missing, re-run the curl install and restart Claude Code. For user-scope installs, check ~/.claude/skills/graphify/SKILL.md instead.
Graphify silently skipped my .docx files.
You need the [office] extra: uv tool install 'graphifyy[office]'. Same pattern for [video] (audio/video transcription) and [mcp] (MCP server mode).
Extraction failed mid-run with API errors and I still got a graph.json.
Graphify writes whatever it could extract even if the semantic pass partially failed. AST extraction is local and deterministic, so the code-only portion of the graph is intact. Fix the credential or backend issue, then run graphify update . to fill in the missing semantic nodes.
Graphify fell back to Claude subagents even though I wanted Gemini.
If GEMINI_API_KEY is set but invalid, Graphify will detect the failure and fall back to Claude subagents automatically. This is what happened on my MemMachine run — the fallback worked fine, but it means extraction ran entirely through my Claude Code subscription rather than splitting across backends. Check your key with curl before the run if you care which backend handles the semantic pass. The final output will note the fallback: Gemini fallback after API_KEY_INVALID.
FAQ
Do I need a .graphifyignore?
No. Graphify will scan everything not under .git/ if you don’t have one. Add it when you want to exclude noisy directories (node_modules/, .venv/, generated docs, AGENTS.md/CLAUDE.md files) from the graph. Same syntax as .gitignore. The .gitignore itself is not automatically read — these are separate files with separate purposes.
Where should graphify-out/ go relative to git?
Commit graphify-out/GRAPH_REPORT.md, graph.html, and graph.json so teammates start with the same map. Gitignore graphify-out/manifest.json (mtime-based, breaks after git clone) and graphify-out/cost.json (local token-tracking). The cache/ directory is optional — commit it for faster shared rebuilds, skip it to keep the repo small.
Can I run Graphify against a local model on my own hardware? Yes. Two paths depending on what you’re running:
For vLLM, LM Studio, llama-server, or anything else that speaks the OpenAI API, use --backend openai and override the base URL. My setup is Qwen 3.6 27B served by vLLM on my DGX Spark:
export OPENAI_BASE_URL="http://dgx-spark.local:8000/v1"
export OPENAI_API_KEY="dummy"   # vLLM ignores it; the SDK requires it set

graphify extract . \
  --backend openai \
  --model Qwen/Qwen3-27B-Instruct \
  --max-concurrency 4
vLLM batches requests well, so 4 concurrent chunks is fine — bump higher if your --max-num-seqs allows. Use the exact model name vLLM was launched with (whatever shows up in GET /v1/models).
For native Ollama, use --backend ollama instead, and drop concurrency to 1 — Ollama serializes requests and parallel chunks queue badly:
graphify extract . --backend ollama --model qwen3:27b --max-concurrency 1
Either way, the entire pipeline stays local: tree-sitter on code, faster-whisper on audio, your local model on docs. Nothing leaves the box.
What’s the difference between the skill and graphify extract . (CLI)?
They do the same work via different entry points. The skill is invoked by Claude Code internally when you ask it to run graphify — Claude calls /graphify . as a slash command on your behalf, using your subscription for semantic extraction. The CLI (graphify extract . in a shell) talks directly to whichever --backend you specify and needs that backend’s API key (except ollama and openai with a local OPENAI_BASE_URL, which stay local).
Does Graphify replace my IDE’s symbol search?
No — and that’s the point. Symbol search finds Neo4jBackend in your code; the graph tells you Neo4jBackend is connected to EpisodicMemory.write(), to a docker-compose service definition, to two integration adapters, and to a docstring in docs/architecture.md that explains why the connection looks the way it does. Different tool, different question.
How do I keep Graphify and MemMachine in sync as the codebase evolves?
Two hooks: graphify hook install rebuilds the Graphify graph on every commit; MemMachine’s profile and episodic memory update automatically as you interact with your agents. Neither needs the other to function. The composition is in the agent: an MCP-capable client like Claude Desktop or Cursor can call both servers in the same turn.
Can I share the graph with my team?
Yes — that’s what committing graphify-out/ is for. One person runs /graphify . and commits the output. Everyone else pulls and gets the graph immediately. The post-commit hook keeps it incremental from there.
What about cross-repo queries?
graphify merge-graphs a.json b.json --out merged.json combines two graphs without involving any registry. For a persistent multi-repo setup, graphify global add ./graphify-out/graph.json --as memmachine adds a project into ~/.graphify/global-graph.json, which then spans every repo you’ve registered.
Repository links:
- Graphify — github.com/safishamsi/graphify · graphifylabs.ai
- MemMachine — github.com/MemMachine/MemMachine · memmachine.ai